
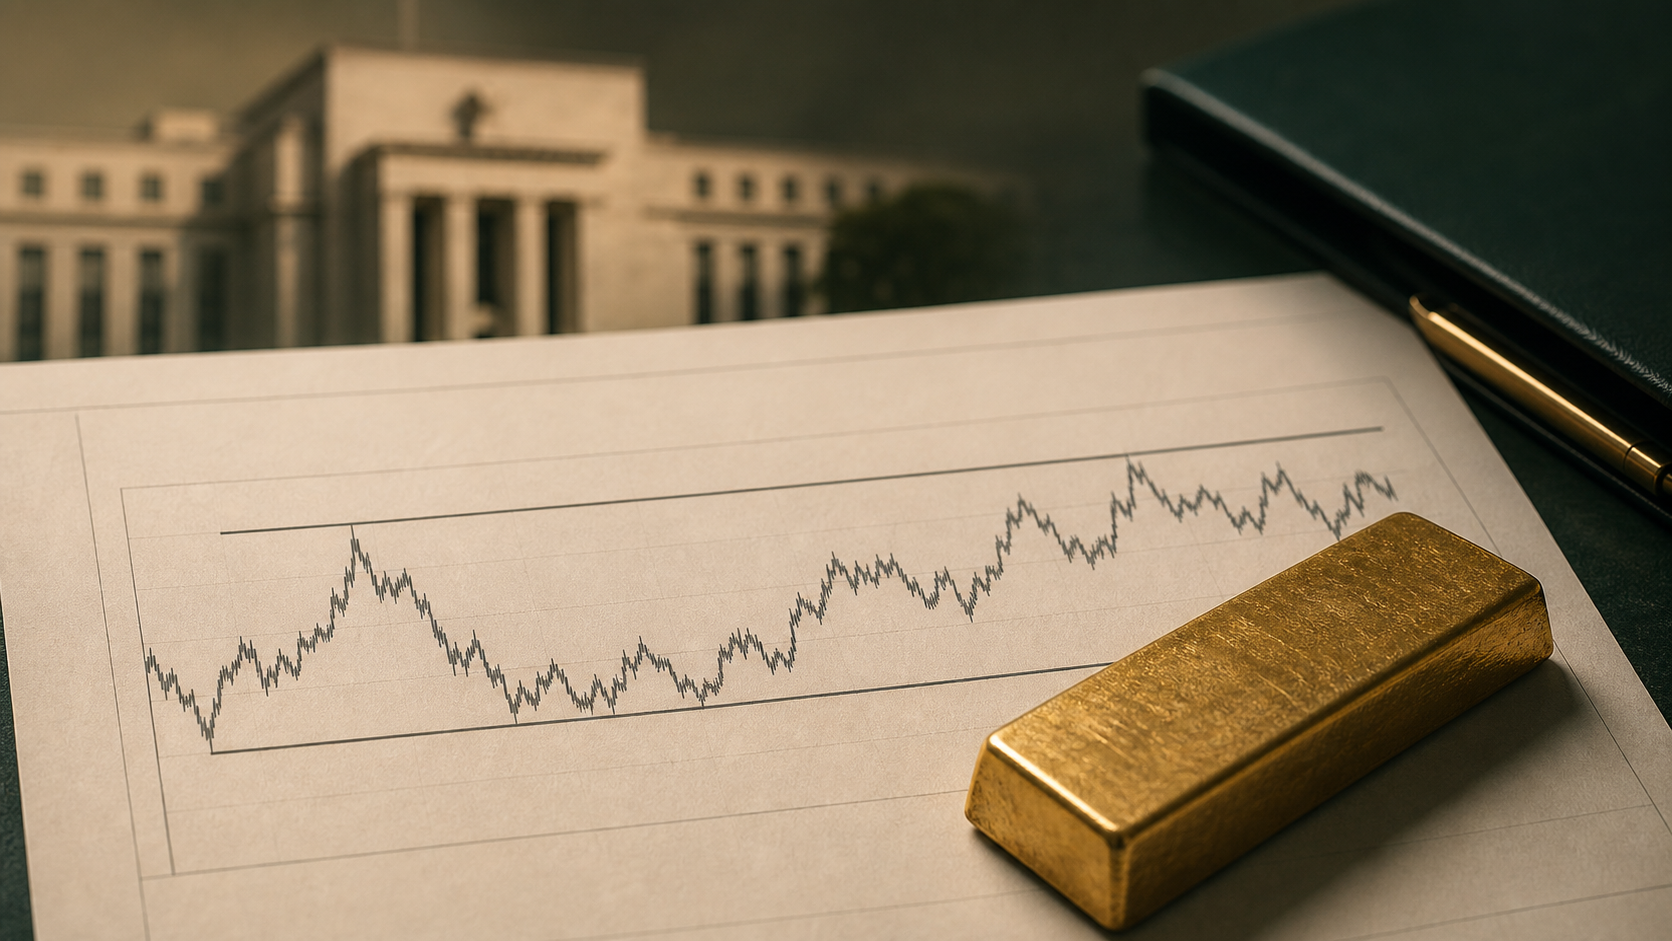
THE TECHNICAL SETUP
Gold enters Fed day with weak momentum, but an intact range.
Gold is trading near the lower half of its recent 20-session range ahead of today’s Federal Reserve decision. The technical picture remains soft, but the price is still above the range low, leaving several credible post-Fed scenarios open.
This analysis identifies observable levels rather than predicting the policy decision or guaranteeing how gold will react.
Gold price snapshot
GoldPriceNow’s live feed placed gold at $4,032.30 per troy ounce and silver at $57.884shortly after 05:32 UTC. A separate technical calculation run seconds later used a gold price of $4,031.70.
Gold’s seven-day change stood at −2.97%, while its 30-day change remained slightly positive at +0.13%. The 14-session RSI was 41.4, below the neutral midpoint but above the conventional oversold threshold used in GoldPriceNow’s model.
That combination describes weak recent momentum. It does not establish that another decline must follow.
The gold levels to watch
$3,993.55: the recent range low
The lowest gold reference in the latest 20-session window is $3,993.55. It is the nearest verified downside boundary in the current dataset and sits just below the psychologically visible $4,000 area.
Holding above the range low would keep gold inside its recent structure. A sustained break below it would invalidate that range and require a fresh technical calculation before identifying another support reference.
$4,075.20: the first recovery test
The 20-day simple moving average is $4,075.20, about $43 above the technical snapshot price. Because gold is below that average, a move back above it would be an early sign that short-term price structure is improving.
A brief move through the average would be less informative than a sustained hold. Readers can follow updated prices through the GoldPriceNow technical dashboard.
$4,164.15: the upper range boundary
The latest 20-session high is $4,164.15. It is the clearest verified upper boundary if gold first reclaims its 20-day average. The higher 50-day average, at $4,204.75, remains above both the current price and the recent range high.
Silver remains inside its own range
Silver was quoted at $57.884 per ounce, while its technical calculation used $57.848. Its 20-session range was $55.29–$62.255, with a 20-day average of $58.664 and an RSI of 46.3.
Silver therefore sits below its short-term average but above its recent range low. A recovery above $58.664 would improve the immediate structure; a break below $55.29 would invalidate the current range.
The calendar can quickly change the setup
The Federal Reserve lists its policy announcement for 2:00 p.m. Eastern time, or 18:00 UTC, followed by a press conference at 2:30 p.m. Eastern, or 18:30 UTC.
The latest official U.S. Treasury curve placed the 10-year par yield at 4.61% on July 28. That is an end-of-day government reference, not a live intraday quote.
The next scheduled macro test follows on July 30, when the Bureau of Economic Analysis releases the Q2 GDP advance estimate and June personal income and outlays at 12:30 UTC. Readers can track these events through the GoldPriceNow economic calendar.
Conclusion
Gold enters the Fed decision below its 20-day, 50-day and 200-day moving averages, but still inside its verified 20-session range. The immediate map is straightforward: $3,993.55 is the lower boundary, $4,075.20 is the first recovery test and $4,164.15 is the upper boundary.
The announcement may produce a fast move in either direction. Waiting to see which level holds is more defensible than treating the first reaction as a forecast.