
TECHNICAL ANALYSIS
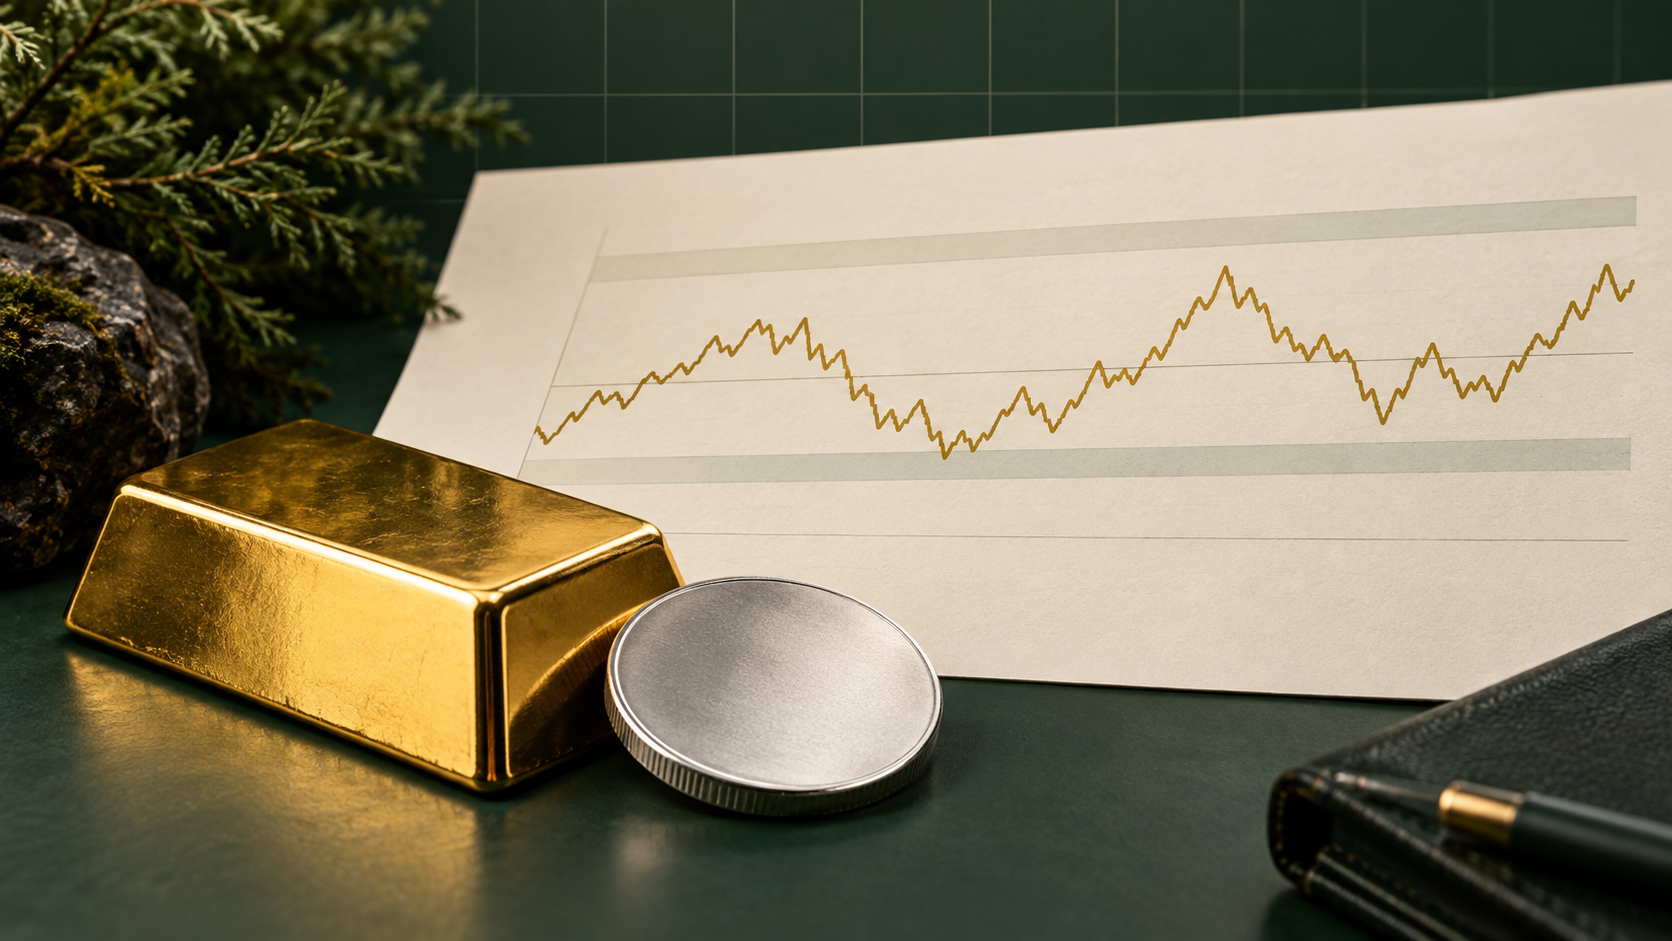
Gold is trading inside a technically important band rather than confirming a clean trend. At 08:16 UTC on September 9, GoldPriceNow’s indicative spot reference showed gold at $4,405.50 an ounce and silver at $66.76. Gold remains above its 50-session average but below its 20- and 200-session averages, while silver holds the stronger short- and medium-term structure. ( GoldPriceNow quotes)
That split gives traders and physical-metal buyers a practical map for the next two sessions. The levels below are reference points, not forecasts, and they may be crossed quickly around this week’s inflation releases.
Gold remains caught between the 50- and 20-session averages
Gold’s latest technical snapshot places the 50-session simple moving average at $4,254.47, the 20-session average at $4,469.64 and the 200-session average at $4,524.78. The current $4,405.50 reference is therefore about 3.6% above the 50-session measure, 1.4% below the 20-session measure and 2.6% below the 200-session measure. ( Gold technical data)
This alignment is mixed. The price is still above the medium-term 50-session trend reference, but it has not recovered the shorter 20-session average or the longer 200-session average. GoldPriceNow labels the combined signal “slight bearish context,” with two positive and three negative inputs.
Momentum is also restrained rather than extreme. The 14-session RSI is 46.2, inside the dashboard’s balanced range. MACD remains below its signal line, while spot-reference history shows gold up 0.53% across seven sessions and 1.87% across 30 sessions.
The recent 20-session range runs from $4,353.15 to $4,663.70. At the current reference, gold is only about 1.2% above the lower boundary. That proximity makes the range low more immediately relevant than the distant high.
Three confirmation paths for gold
Recovery: A sustained move above the $4,469.64 20-session average would improve the short-term structure. The $4,524.78 200-session average would then become the next confirmation reference. Neither level is a guaranteed destination.
Range hold: If gold remains above $4,353.15 but below $4,469.64, the chart stays in consolidation. Repeated closes inside that band would offer limited evidence of a new directional trend.
Breakdown: A sustained move below $4,353.15 would weaken the current range structure. The $4,254.47 50-session average would then be the next visible trend reference, not an assumed price target.
Readers can monitor updated calculations on GoldPriceNow’s Technical Signals page and set a price alert around a level they want to revisit.
Silver keeps the stronger relative setup
Silver’s technical structure is firmer. At $66.76, it stands above its $66.46 20-session average and $62.18 50-session average, although it remains below the $72.48 200-session average. Its RSI is 57.6, which the dashboard classifies as positive momentum, but MACD is still below its signal line. ( Silver technical data)
Spot-reference history shows silver up 4.82% across seven sessions and 4.42% across 30 sessions, both stronger than gold over the same methodology. The current spot gold-to-silver ratio is about 66.0, meaning one ounce of gold is worth roughly 66 ounces of silver at the quoted references.
Silver’s 20-session range is $63.36 to $70.26. Holding above the $66.46 short-term average would preserve its present advantage over gold. A move below that average would soften the setup, while a move above $70.26 would mark a fresh break from the current range. The $72.48 200-session average remains a separate, higher confirmation test.
Buyers should not treat relative strength as lower risk. The useful observation is narrower: silver currently has better short- and medium-term trend alignment, but neither metal is above its 200-session average.
Dollar, yields and inflation data can reset the chart
The cross-market backdrop is not fully supportive. A same-morning DXY reference was near 98.8 on September 9. The U.S. Treasury’s official par yield curve placed the 10-year yield at 4.80% on September 8, up from 4.78% on September 4. ( DXY reference; U.S. Treasury)
The next scheduled tests arrive quickly. The Bureau of Labor Statistics will publish the August Producer Price Index at 12:30 UTC on Thursday, September 10, followed by the August Consumer Price Index at 12:30 UTC on Friday, September 11. The European Central Bank will publish its policy decision at 12:15 UTC Thursday and hold its press conference at 12:45 UTC. ( BLS schedule; ECB schedule)
Gold does not have to react in one fixed direction. If inflation data are followed by lower yields and a weaker dollar, a recovery through the 20-session average would carry more confirmation. If yields and the dollar rise while gold loses $4,353.15, the lower side of the range would be more exposed. Mixed cross-market signals would favor continued consolidation until price confirms otherwise.
Track the timing on the economic calendar, compare the broader backdrop on Market Pulse, and review longer seasonal tendencies separately on Gold Seasonality.
What this means for gold and silver buyers
Spot levels are reference prices, not final retail quotes. Coins and bars also reflect dealer premiums, product availability, local taxes and currency conversion. U.S. readers can compare the live reference on the U.S. gold price page, while buyers elsewhere can use GoldPriceNow’s tools to convert weights and estimate metal value.
For staged buyers, the most useful approach is to define which signal matters before the data arrive: a gold recovery above $4,469.64, a loss of $4,353.15, or silver’s ability to remain above $66.46. Waiting for confirmation can reduce the temptation to interpret every intraday move as a new trend.
Conclusion
Gold enters the inflation window at $4,405.50, between its 50- and 20-session averages and close to the lower edge of its recent range. Silver retains stronger relative momentum above its 20- and 50-session averages, but it too remains below the 200-session trend measure.
The chart is mixed, not directionless: $4,353.15 and $4,469.64 define gold’s immediate decision band, while $66.46 is the first short-term reference for silver. Thursday’s PPI, the ECB decision and Friday’s CPI could determine whether those levels confirm a recovery, a breakdown or more consolidation.
Independent data · No investment advice.